
안녕하세요? 이번 글은 geemap를 통해 Earth Engine Data Catalog에서 제공하는 WorldClim BIO Variables V1 데이터를 조회하고 다운로드 받는 과정을 정리해 보겠습니다.
Earth Engine Data Catalog
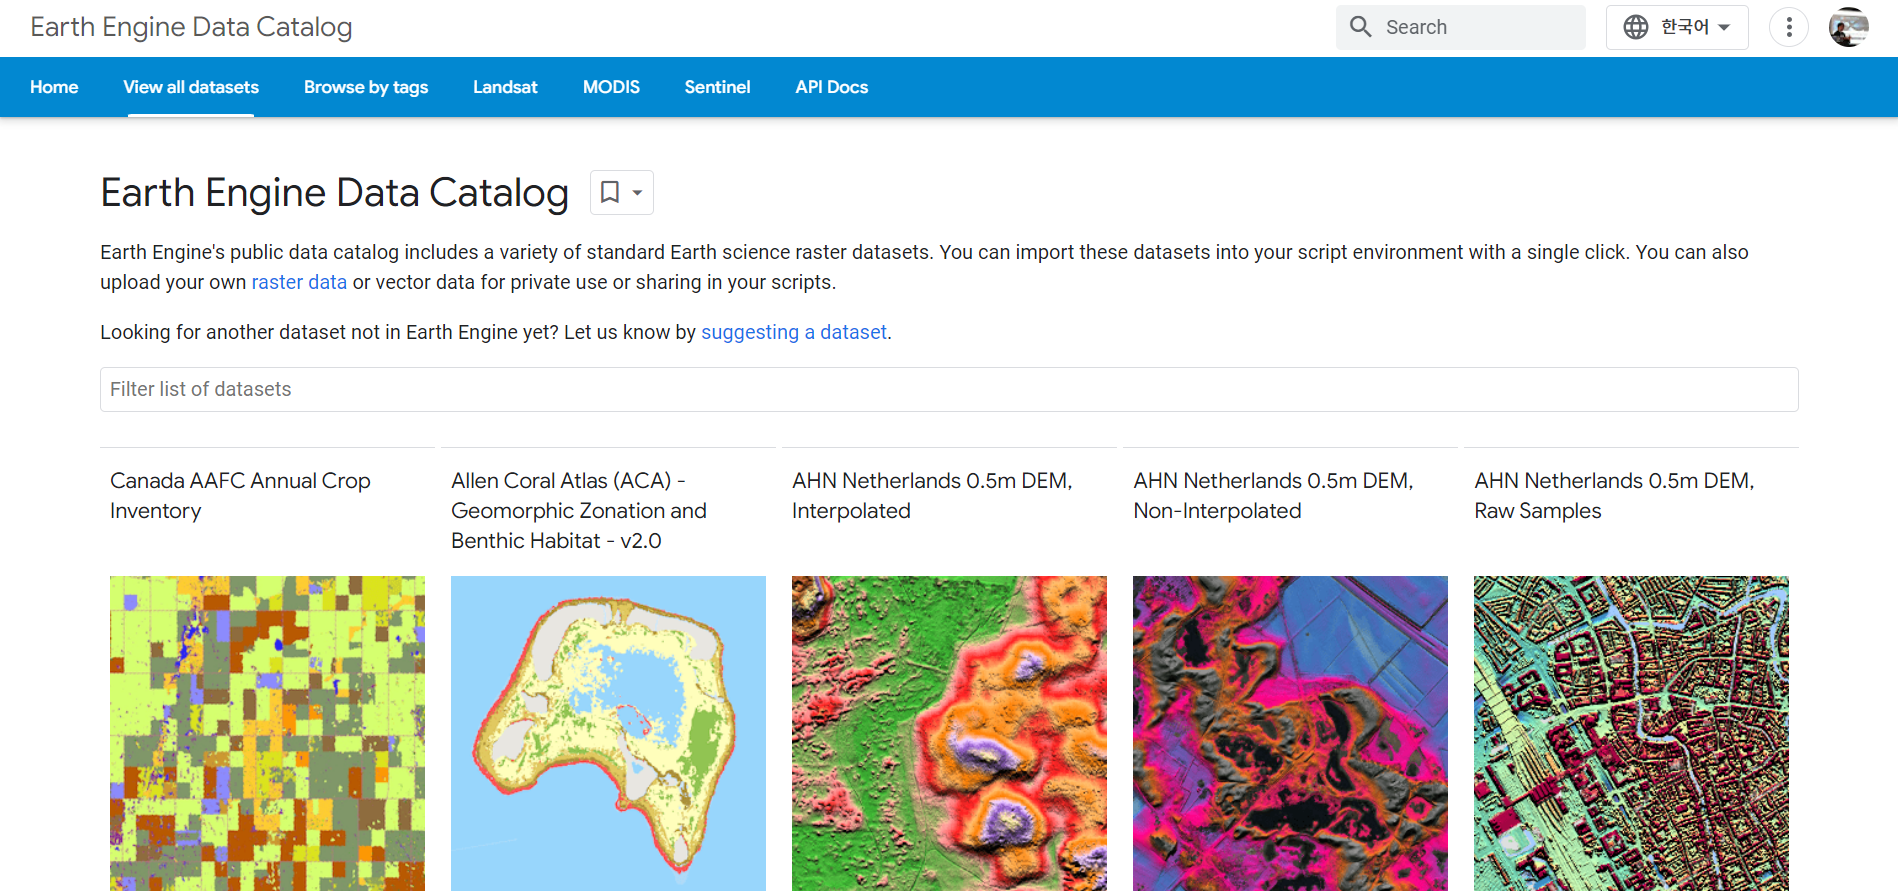
Earth Engine Data Catalog는 Google Earth Engine에서 사용 가능한 데이터셋 및 이미지 컬렉션에 대한 정보를 포함하는 온라인 데이터 리포지토리입니다. 데이터셋(Dataset)은 Google Earth Engine에서 관리되는 정형 데이터를, 이미지 컬렉션(Image Collection)은 동일한 데이터셋의 여러 시간 스탬프들을 묶어서 처리하기 쉽게 만든 개념입니다.
WorldClim BIO Variables V1
WorldClim BIO Variables V1 | Earth Engine Data Catalog | Google for Developers
WorldClim V1 Bioclim provides bioclimatic variables that are derived from the monthly temperature and rainfall in order to generate more biologically meaningful values. The bioclimatic variables represent annual trends (e.g., mean annual temperature, annua
developers.google.com
WorldClim BIO Variables V1은 전세계적으로 널리 사용되는 기후 데이터셋 하나로, 지구 환경 연구와 모델링에 활용되는 중요한 데이터셋입니다.

WorldClim BIO Variables V1 데이터셋은 총 19개의 기후 변수들이 포함되어 있으며, 각 변수들은 30초(약 1㎢) 공간해상도로 제공됩니다.

WorldClim BIO Variables V1 데이터 검색 및 다운로드
geemap과 ee 모듈을 가져오고, Earth Engine에 인증하고 초기화하는 작업을 수행합니다. ee.Authenticate() 함수는 Earth Engine과 연결된 Google 계정으로 인증하고 인증 토큰을 얻는 역할을 합니다. 한 번 인증이 완료되면, 그 이후에는 인증 코드를 다시 입력할 필요 없이 해당 인증 토큰을 사용하여 Earth Engine과 통신할 수 있습니다.
import geemap
import ee
# Earth Engine 인증
ee.Authenticate()
# Earth Engine 초기화
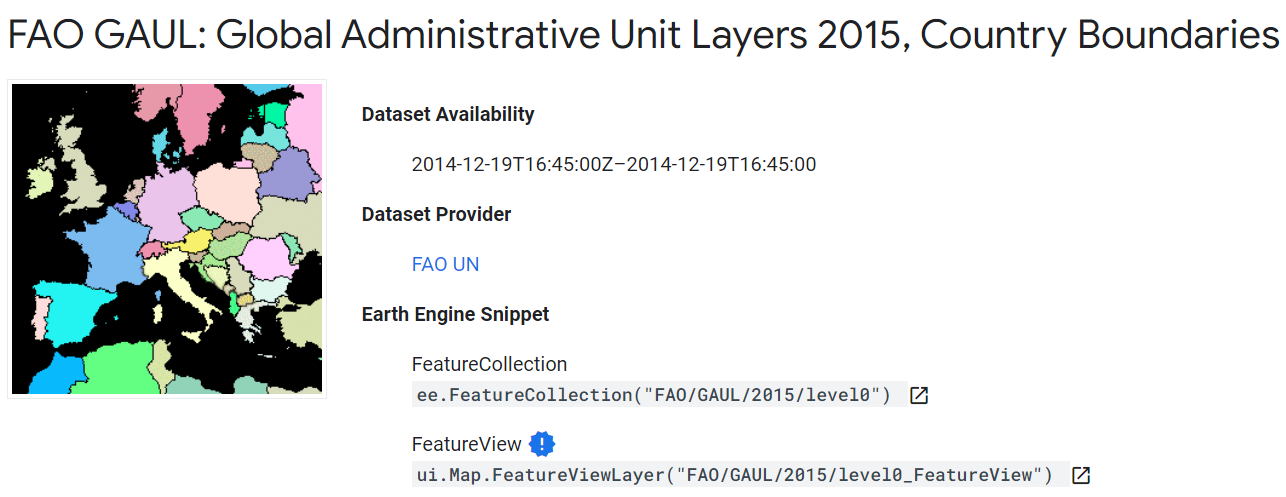
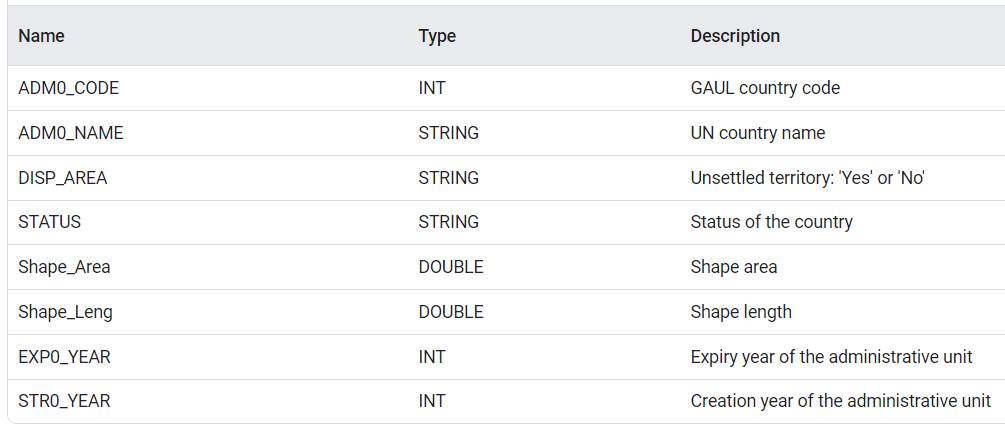
ee.Initialize()Earth Engine Data Catalog에서 FAO GAUL (Global Administrative Unit Layers) 2015 국가 경계를 불러와, 대한민국을 필터링하고 해당 경계를 시각화합니다. FeatureCollection은 점, 선, 폴리곤과 같은 공간 데이터를 나타내는데 사용됩니다.
FAO GAUL: Global Administrative Unit Layers 2015, Country Boundaries | Earth Engine Data Catalog | Google for Developers
The Global Administrative Unit Layers (GAUL) compiles and disseminates the best available information on administrative units for all the countries in the world, providing a contribution to the standardization of the spatial dataset representing administra
developers.google.com
# FAO GAUL: Global Administrative Unit Layers 2015, Country Boundaries
countries = ee.FeatureCollection("FAO/GAUL/2015/level0")

# 'ADM0_NAME' 필드를 기준으로 '대한민국' 필터링
kr = countries.filter(ee.Filter.eq('ADM0_NAME', 'Republic of Korea'))

# 지도 생성
Map = geemap.Map()

# 지도에 경계 표시
Map.centerObject(kr, 7) # 경계 중심으로 지도 확대
Map.addLayer(kr, {}, "Republic of Korea")

# 지도 출력
Map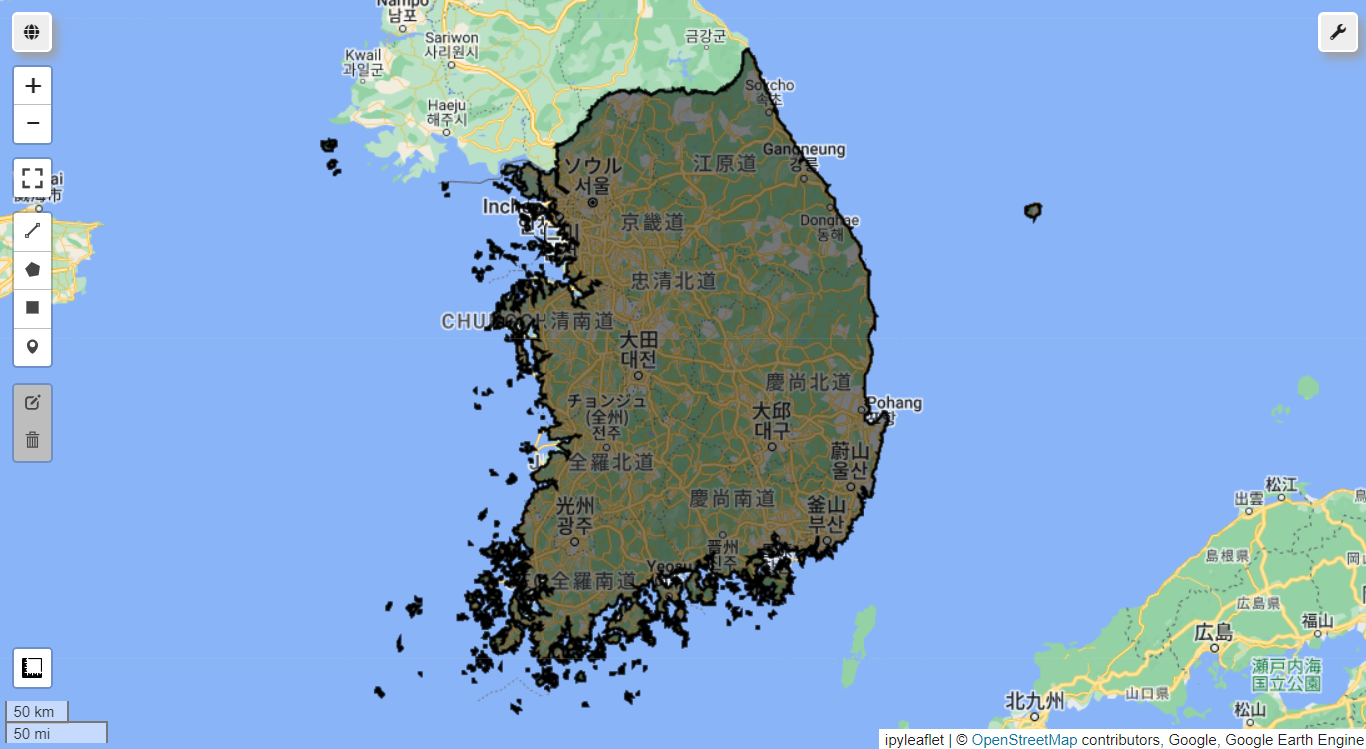
FeatureCollection은 GeoJSON 형식으로 내보내어 QGIS 등 외부에서도 쉽게 사용하고 공유할 수 있습니다.
# GeoJSON 파일로 FeatureCollection 내보내기
output_path = 'D:/GEODATA/kr.geojson'
geemap.ee_to_geojson(kr, filename=output_path)
WorldClim BIO Variables V1 데이터셋의 bio01 변수(연간 평균 온도)를 시각화해 봅니다. 값에 0.1을 곱하여 기후 데이터의 단위를 조정합니다.

# WorldClim BIO Variables V1
worldclim = ee.Image('WORLDCLIM/V1/BIO')

bio01 = worldclim.select('bio01').multiply(0.1)
visParams = {
    'min': -23,
    'max': 30,
    'palette': ['blue', 'purple', 'cyan', 'green', 'yellow', 'red']}

# 지도 생성
Map = geemap.Map()

Map.centerObject(kr, 4) # 경계 중심으로 지도 확대
Map.addLayer(bio01, visParams, 'Annual mean temperature')
Map
WorldClim BIO Variables V1 데이터셋의 각 변수를 대한민국 영역으로 잘라내어 GeoTIFF 파일로 저장합니다. 각 변수의 기후데이터의 단위를 조정하여 D:/GEODATA/ 폴더에 자동 생성됩니다.
# 각각의 변수를 정의하여 대한민국 영역으로 잘라내고 GeoTIFF 파일로 저장
output_folder = 'D:/GEODATA/'
for i in range(1, 20):
    # WorldClim BIO Variables V1 데이터셋에서 해당 변수 선택
    band_name = 'bio{:02d}'.format(i)
    image = worldclim.select(band_name)

    # 'bio01', 'bio02', 'bio05'부터 'bio11'까지는 0.1을 곱하고, 'bio04'는 0.02를 곱함
    if i in [1, 2, 5, 6, 7, 8, 9, 10, 11]:
        image = image.multiply(0.1)
    elif i == 4:
        image = image.multiply(0.02)
    else:
        image = image.multiply(1.0)

    # 대한민국 영역으로 잘라내기
    image_kr = image.clipToCollection(kr)

    # 저장할 파일 경로
    output_file = output_folder + 'bio{:02d}.tif'.format(i)

    # GeoTIFF로 저장
    geemap.ee_export_image(image_kr, filename=output_file, region=kr.geometry(), scale=1000)
GeoTIFF 파일들을 읽어와서 플롯을 그려본 결과입니다.
import os
import matplotlib.pyplot as plt
import rasterio

# GeoTIFF 파일저장 폴더 경로
folder_path = 'D:/GEODATA/'

# 변수 이름 리스트
variables = ['bio{:02d}'.format(i) for i in range(1, 20)]

# 차트 생성
fig, axes = plt.subplots(nrows=5, ncols=4, figsize=(16, 20))

# 변수들을 순회하며 플롯 그리기
for i, var in enumerate(variables):
    # GeoTIFF 파일 경로
    file_path = os.path.join(folder_path, f'{var}.tif')

    # GeoTIFF 파일을 rasterio로 열어 데이터 가져오기
    with rasterio.open(file_path) as src:
        data = src.read(1)

    # 플롯 그리기
    row_idx = i // 4
    col_idx = i % 4
    ax = axes[row_idx, col_idx]
    im = ax.imshow(data, cmap='viridis', aspect='auto')
    ax.set_title(var)
    ax.axis('off')

# 빈 칸 숨기기
for i in range(len(variables), 20):
    row_idx = i // 4
    col_idx = i % 4
    axes[row_idx, col_idx].axis('off')

# 차트 저장
output_chart_path = os.path.join(folder_path, 'worldclim_bio_vars.png')
plt.savefig(output_chart_path, bbox_inches='tight', pad_inches=0.1)

# 차트 출력
plt.show()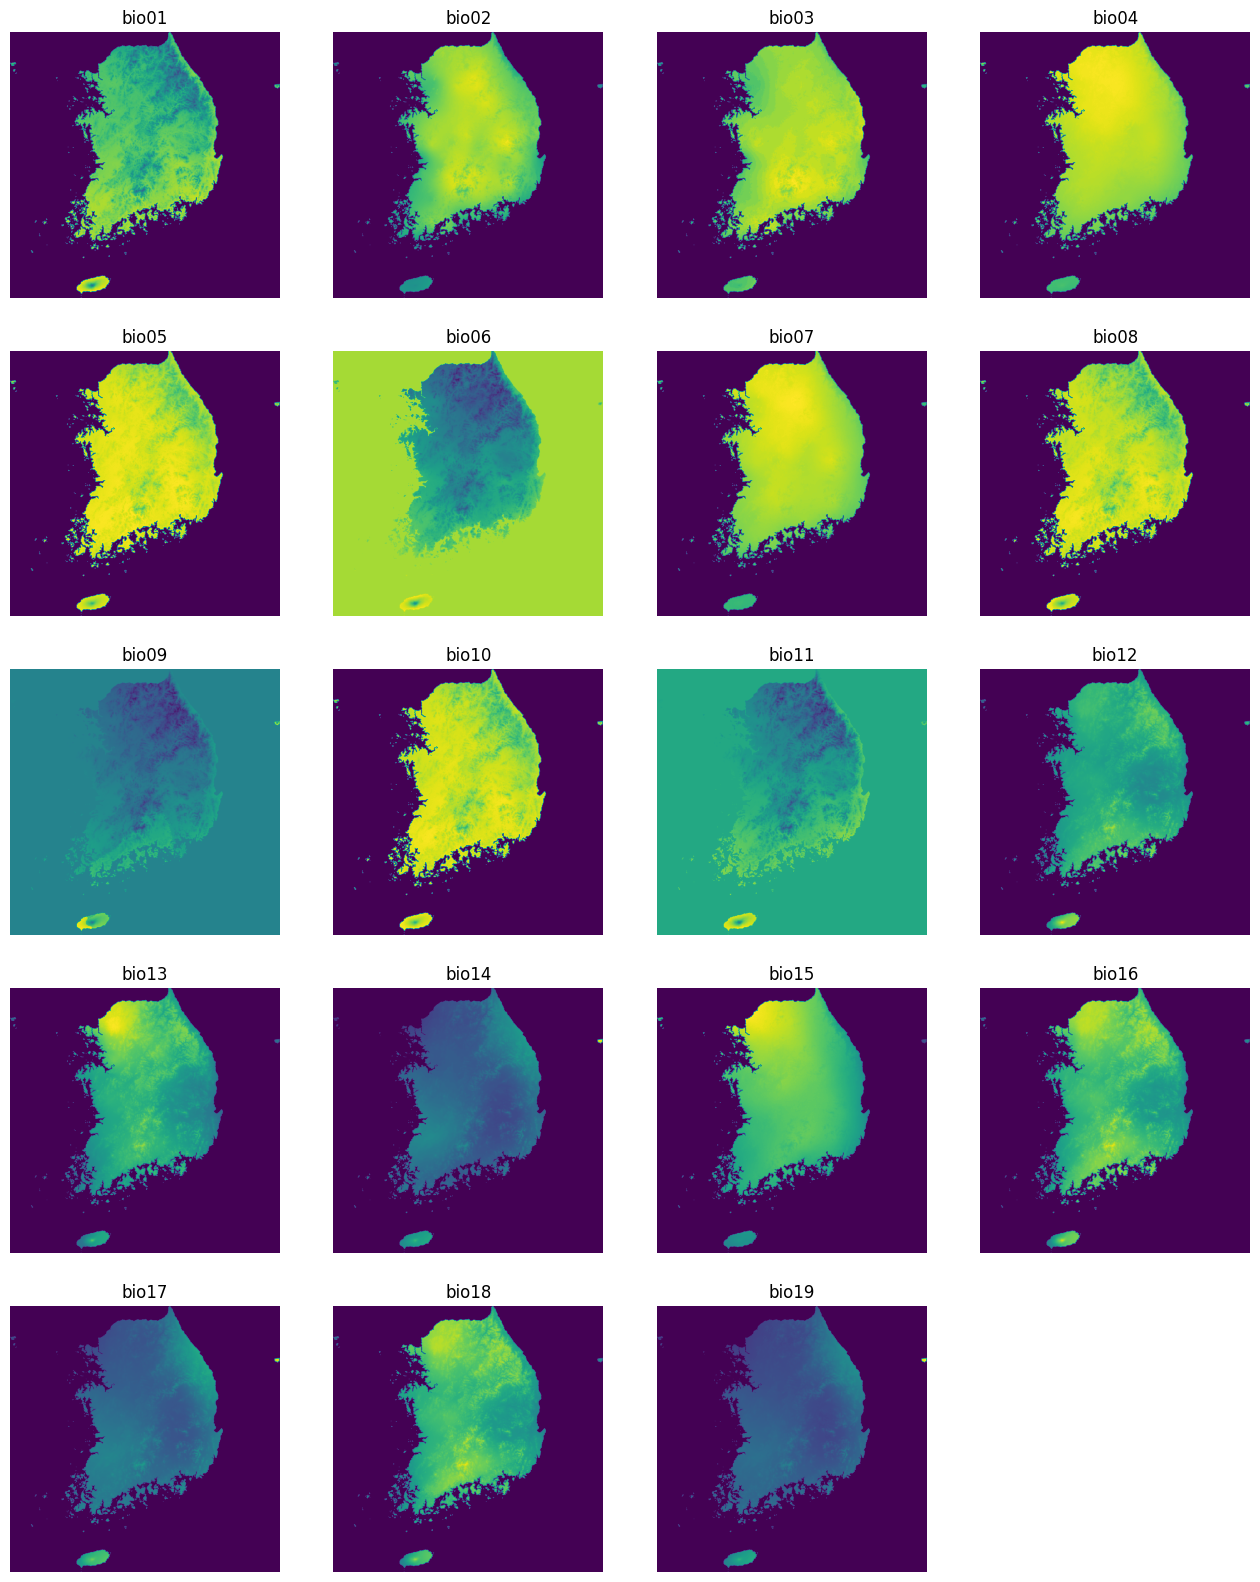
이제 해당 데이터는 QGIS에서도 다룰 수 있습니다. 여기까지 geemap를 통해 Earth Engine Data Catalog에서 제공하는 WorldClim BIO Variables V1 데이터를 조회하고 다운로드 받는 과정을 정리해 봤습니다.
