
안녕하세요? 이번 글에서는 contextily(컨텍스틸리) 패키지를 이용해 matplotlib에 배경 지도(basemap)로 타일 지도를 추가하는 방법을 간단히 소개해 보겠습니다.

contextily는 matplotlib 기반의 지도 시각화에서 배경 지도(basemap)로 다양한 타일 지도를 손쉽게 추가할 수 있는 패키지입니다. 또한, 온라인 타일 지도를 지리공간 래스터 파일 형태로 디스크에 저장하는 기능도 제공합니다.
contextily는 경계 상자(bounding box)를 WGS84 좌표계(EPSG:4326), 구면 메르카토르(Spherical Mercator, EPSG:3857), 두 좌표계 모두로 전달할 수 있어, 다양한 지리공간 데이터와 유연하게 연동할 수 있습니다. 이 글에서는 pygbif 패키지를 사용해 생물종 출현 데이터를 수집한 뒤, 해당 출현 위치 데이터와 타일 지도를 함께 시각화해 보겠습니다.
import pandas as pd
import geopandas as gpd
import matplotlib.pyplot as plt
import contextily as cx

from pygbif import occurrences as occ
아래 코드는 GBIF(Global Biodiversity Information Facility) 출현(occurrence) API를 이용해 특정 종의 관측 위치 정보를 수집하고, 이를 GeoDataFrame으로 변환하는 함수입니다.
def gbif_occ_to_gdf(
    scientificName: str, country: str, *, limit: int = 300, max_records: int = 3000
) -> gpd.GeoDataFrame:
    """
    GBIF occurrence API에서
    - scientificName, country로 검색
    - basisOfRecord == HUMAN_OBSERVATION
    - 좌표 있는 레코드만(hasCoordinate) 수집
    후 GeoDataFrame(EPSG:4326)으로 반환.
    """
    rows = []
    for offset in range(0, max_records, limit):
        res = occ.search(
            scientificName=scientificName,
            country=country,
            basisOfRecord="HUMAN_OBSERVATION",
            hasCoordinate=True,
            limit=limit,
            offset=offset,
        )
        batch = res.get("results", [])
        if not batch:
            break
        rows.extend(batch)
    if not rows:
        return gpd.GeoDataFrame(geometry=[], crs="EPSG:4326")
    df = pd.DataFrame(rows)

    # 좌표 null 제거
    df = df[df["decimalLatitude"].notna() & df["decimalLongitude"].notna()]

    gdf = gpd.GeoDataFrame(
        df,
        geometry=gpd.points_from_xy(df["decimalLongitude"], df["decimalLatitude"]),
        crs="EPSG:4326",
    )
    return gdf
이 함수를 사용해 도미니카공화국(DO)에서 관측된 매부리바다거북(Eretmochelys imbricata) 출현 데이터를 불러오고, 종명, 관측일, 연도, 좌표 등 주요 속성 일부를 확인해 봅니다.
# 도미니카공화국(DO)의 매부리바다거북(Hawksbill turtle) 출현 데이터
db = gbif_occ_to_gdf("Eretmochelys imbricata", "DO", max_records=3000)
db[
    [
        "species",
        "scientificName",
        "eventDate",
        "year",
        "decimalLatitude",
        "decimalLongitude",
        "basisOfRecord",
    ]
].head()
여기서 extent는 지도에 표시할 영역을 (xmin, xmax, ymin, ymax) 형식의 경위도 범위(EPSG:4326)로 정의합니다.
# extent (xmin, xmax, ymin, ymax)
extent = (-72.0, -68.0, 17.5, 20.0)
이후 cx.add_basemap()을 사용해 배경 타일 지도를 추가합니다. 기본 설정(인도주의 오픈스트리트맵), CartoDB Positron, OpenStreetMap Mapnik 등 서로 다른 타일 소스를 적용하고, 각 결과를 고해상도 PNG 이미지로 저장해 봅니다.
ax = db.plot(color="red", figsize=(8, 8))
ax.axis(extent)
cx.add_basemap(ax, crs=db.crs)
plt.savefig("osm_hot.png", dpi=300, bbox_inches="tight")
plt.show()
ax = db.plot(color="red", figsize=(8, 8))
ax.axis(extent)
cx.add_basemap(ax, source=cx.providers.CartoDB.Positron, crs=db.crs)
plt.savefig("cartodb_positron.png", dpi=300, bbox_inches="tight")
plt.show()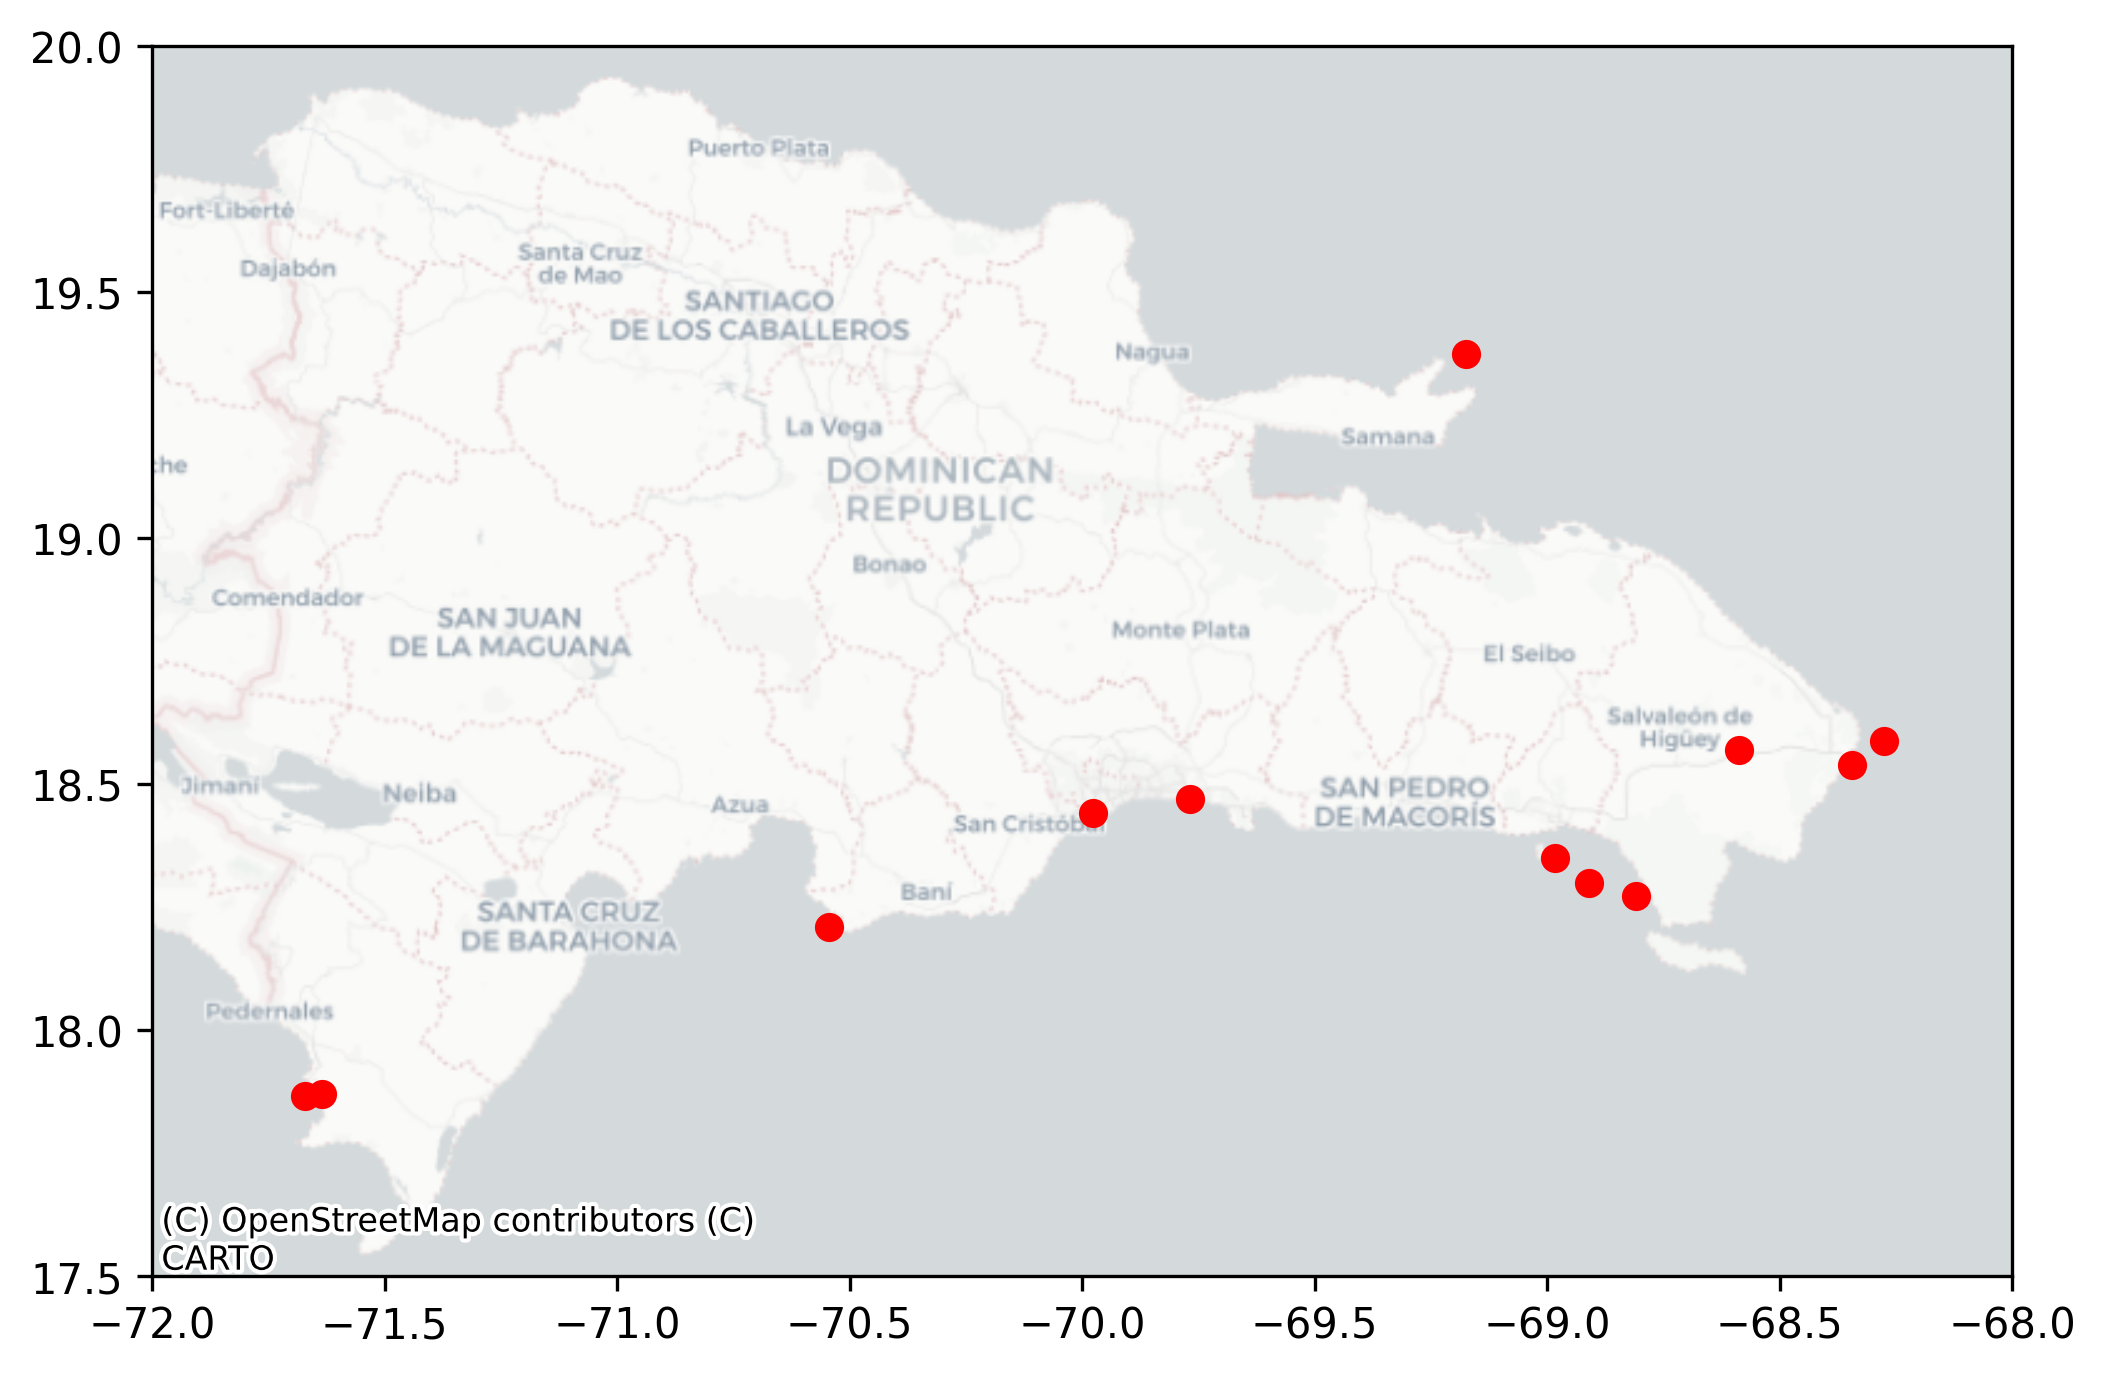
ax = db.plot(color="red", figsize=(8, 8))
ax.axis(extent)
cx.add_basemap(ax, source=cx.providers.OpenStreetMap.Mapnik, crs=db.crs)
plt.savefig("osm_mapnik.png", dpi=300, bbox_inches="tight")
plt.show()
동일한 경계 영역을 cx.bounds2raster()에 전달해 타일을 GeoTIFF 파일로 저장할 수도 있습니다. 이 파일은 이후 QGIS 등에서 배경 래스터 지도로 재사용할 수 있습니다.
w, e, s, n = extent

_ = cx.bounds2raster(
    w, s, e, n,
    ll=True,  # 경위도 좌표 (EPSG:4326)
    path="dominican_republic.tif",
    source=cx.providers.OpenStreetMap.Mapnik
)