안녕하세요? 이번 글은 Google Earth Engine의 Maxent 소프트웨어 구현 기능을 간략히 소개해 보겠습니다. Maxent는 알려진 출현 위치와 대규모 '배경' 위치의 환경 데이터를 사용하여 종 분포 확률을 모델링하는 데 사용됩니다. 자세한 정보와 인용은 다음을 참조하시면 되겠습니다.
Phillips, et. al., 2004 A maximum entropy approach to species distribution modeling, Proceedings of the Twenty-First International Conference on Machine Learning
Maxent
Maxent is now open source! Use this site to download Maxent software for modeling species niches and distributions by applying a machine-learning technique called maximum entropy modeling. From a set of environmental (e.g., climatic) grids and georeference
biodiversityinformatics.amnh.org
Google Earth Engine에서 ee.Classifier.amnhMaxent 메소드는 Maximum Entropy(최대 엔트로피) 분류기를 생성합니다. 여기서 AMNH는 미국 자연사박물관(American Museum of Natural History)의 약어입니다. Maxent의 아이디어는 미국 자연사박물관 내 생물다양성보전센터(Center for Biodiversity and Conservation)에서 AMNH와 AT&T-Research 간의 공공-민간 파트너십을 통해 처음 구상되었습니다.
ee.Classifier.amnhMaxent | Google Earth Engine | Google for Developers
Export.classifier
developers.google.com
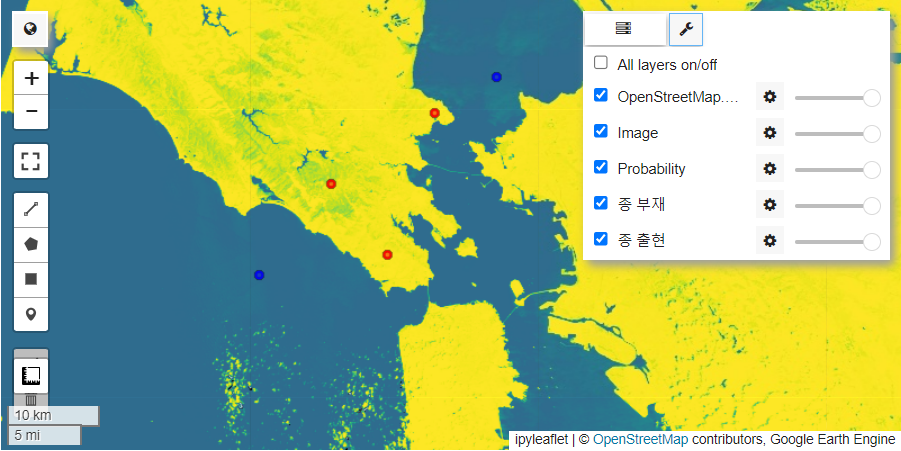
출력은 'probability'라는 이름의 단일 밴드로 모델링된 확률을 포함하며, 'writeClampGrid' 인수가 참일 경우 'clamp'라는 추가 밴드가 포함됩니다.
Google Earth Engine에서 종 분포 확률을 모델링하는 방법은 제가 집필한 Earth Engine Community Tutorial - Species Distribution Modeling에 상세히 소개되어 있습니다. 따라서 이 글은 Maxent 구현 기능 예제를 중심으로 정리하겠습니다. 먼저 Earth Engine을 인증/초기화 합니다.
Species Distribution Modeling | Google Earth Engine | Google for Developers
Send feedback Species Distribution Modeling Stay organized with collections Save and categorize content based on your preferences. Send feedback Except as otherwise noted, the content of this page is licensed under the Creative Commons Attribution 4.0 Lice
developers.google.com
import ee
import geemap
import geemap.colormaps as cm

# Earth Engine 인증
ee.Authenticate()

# Earth Engine 초기화
ee.Initialize(project='my-project')
일단, 출현/부재 훈련 데이터를 임의 생성합니다. 아래 코드는 ee.Classifier.amnhMaxent 메소드의 예제 코드를 그대로 차용했습니다.
# 출현/부재 훈련 데이터 생성
training_data = ee.FeatureCollection([
    # 종 출현 지점
    ee.Feature(ee.Geometry.Point([-122.39567, 38.02740]), {'presence': 1}),
    ee.Feature(ee.Geometry.Point([-122.68560, 37.83690]), {'presence': 1}),
    # 종 부재 지점
    ee.Feature(ee.Geometry.Point([-122.59755, 37.92402]), {'presence': 0}),
    ee.Feature(ee.Geometry.Point([-122.47137, 37.99291]), {'presence': 0}),
    ee.Feature(ee.Geometry.Point([-122.52905, 37.85642]), {'presence': 0}),
    ee.Feature(ee.Geometry.Point([-122.03010, 37.66660]), {'presence': 0})
])
환경 조건으로 Landsat 8호 이미지를 가져와 반사율 밴드를 선택해 보겠습니다. Earth Engine Snippet에서 각각의 약어는 다음을 지칭합니다.
- C02: Collection 2
- T1: Tier 1
- L2: Level 2
- 044034: 044는 경로 번호(Path), 034는 열 번호(Row)
- 20200606: 이미지 촬영 날짜
# Landsat 8호 이미지를 가져와 반사율 밴드 선택
image = (ee.Image('LANDSAT/LC08/C02/T1_L2/LC08_044034_20200606')
         .select(['SR_B[1-7]'])
         .multiply(0.0000275).add(-0.2))  # 축척 계수 적용
Landsat 8호 이미지 밴드 객체 내에서 특정 종의 출현/부재 위치에 해당하는 데이터 샘플을 추출합니다. 여기서 `scale` 매개변수는 샘플링의 공간 해상도를 의미합니다.
# 종 출현/부재 위치에서 이미지 샘플링
training = image.sampleRegions(**{
    'collection': training_data,
    'scale': 30
})
이제 Google Earth Engine의 Maxent 분류기를 통해, 종 분포 모델을 정의하고 훈련하는 과정을 실행합니다. 훈련 데이터 내에서 예측하고자 하는 대상 속성(`presence`)을 지정하고, 이미지의 모든 분광 정보를 활용하여 종이 존재할 가능성이 있는 지역을 예측합니다.
# Maxent 분류기 정의 및 훈련
classifier = ee.Classifier.amnhMaxent().train(**{
    'features': training,
    'classProperty': 'presence',
    'inputProperties': image.bandNames()
})
훈련된 Maxent 분류기를 이용하여 위성 이미지로 종의 분포를 예측합니다.
# Maxent 분류기를 사용하여 이미지 분류
image_classified = image.classify(classifier)
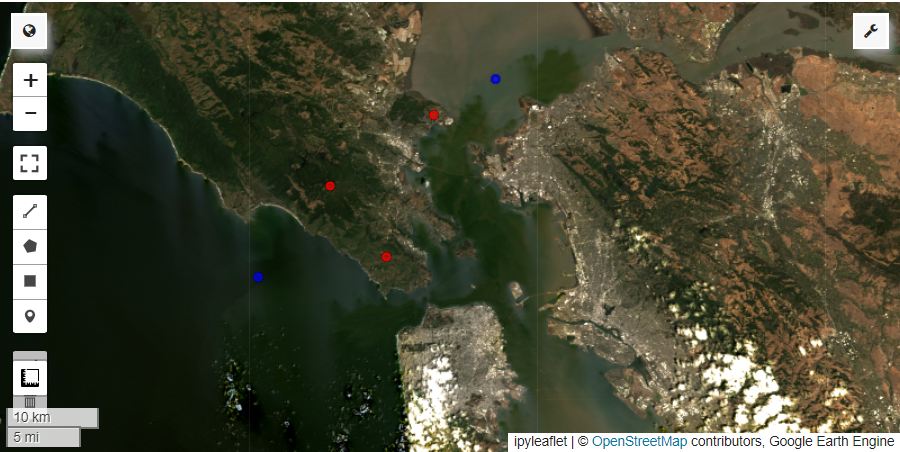
원본 이미지, 종 분포 확률, 훈련 데이터 레이어를 시각화해 봅니다. 종 출현 위치는 파란색, 종 부재 위치는 빨간색으로 표시하였습니다.
# 지도 생성
m = geemap.Map(layout={'height':'400px', 'width':'800px'})

# 원본 이미지 레이어
m.addLayer(
    image.select(['SR_B4', 'SR_B3', 'SR_B2']),
    {'min': 0, 'max': 0.3}, 'Image'
)

# 분류된 확률 레이어
m.addLayer(
    image_classified.select('probability'),
     {'min': 0, 'max': 1, 'palette': cm.palettes.viridis_r}, 'Probability'
)

# 훈련 데이터 레이어
m.addLayer(
    training_data.filter(ee.Filter.eq('presence', 0)), {'color': 'red'},
    '종 부재'
)
m.addLayer(
    training_data.filter(ee.Filter.eq('presence', 1)), {'color': 'blue'},
    '종 출현'
)

# 지도 표시
m.centerObject(training_data, 10)
m


