안녕하세요? 이번 글은 시리즈 글의 일부로 Google Earth Engine과 geemap을 이용한 종 분포 모델링(SDM: Species Distribution Modeling) 구현 방법을 소개해 보겠습니다. 이 글의 내용은 스미소니언 보전생물연구소 연구진 분들이 제공한 JavaScript 소스코드를 Python으로 변환하여 수정, 보완한 것입니다.
Crego, R. D., Stabach, J. A., & Connette, G. (2022). Implementation of species distribution models in Google Earth Engine. Diversity and Distributions, 28, 904–916. https://doi.org/10.1111/ddi.13491
사례 연구 1: 출현-전용 데이터를 이용한 팔색조(Pitta nympha) 서식지 적합성 및 예측 분포 모델링
7. 정확도 평가
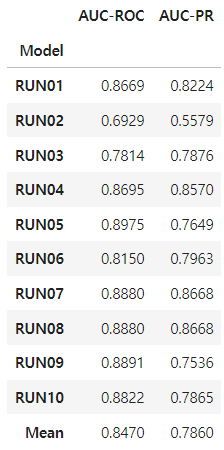
검증 데이터셋을 사용하여 각 실행에 대해 AUC-ROC(Area Under the Curve of the Receiver Operator Characteristic)와 AUC-PR(Area Under the Precision-Recall Curve)를 계산합니다. 그런 다음 n번의 반복에 대해 평균 AUC-ROC 및 AUC-PR를 계산합니다.
각 실행에서 모델 검증에 충분한 지점 수가 있는지 확인하는 것이 중요합니다. 최종 지점 수는 공간 블록의 무작위 분할에 따라 달라지기 때문에 모델 검증에 충분한 출현 및 임의-비출현 지점이 있는지 확인해야 합니다.
# 검증용 데이터셋 추출
TestingDatasets = (ee.List.sequence(3, ee.Number(numiter).multiply(4).subtract(1), 4).map(lambda x: results.get(x)))

# 모델 검증에 충분한 출현 및 임의-비출현 지점이 있는지 확인
def get_sizes(x):
    fc = ee.FeatureCollection(TestingDatasets.get(x))
    presence_size = fc.filter(ee.Filter.eq('PresAbs', 1)).size()
    pseudo_absence_size = fc.filter(ee.Filter.eq('PresAbs', 0)).size()
    return ee.List([presence_size, pseudo_absence_size])

print('Number of presence and pseudo-absence points for model validation',
      ee.List.sequence(0, ee.Number(numiter).subtract(1), 1).map(get_sizes).getInfo())
멸종위기종이나 희귀종과 같은 경우, 출현 데이터가 부족하여 검증용 데이터셋 또한 부족할 수 있습니다. 이는 전문가들의 경험과 지식을 활용한 추가 데이터 수집 또는 관련 다른 데이터를 활용하는 대안이 필요합니다.
Number of presence and pseudo-absence points for model validation [[13, 13], [29, 29], [25, 18], [18, 18], [24, 24], [41, 26], [21, 21], [21, 21], [24, 16], [16, 16]]%%time
# 민감도(sensitivity), 특이도(specificity), 정밀도(precision) 추정
def getAcc(img, TP, GrainSize=GrainSize):
Pr_Prob_Vals = img.sampleRegions(collection=TP, properties=['PresAbs'], scale=GrainSize, tileScale=16)
seq = ee.List.sequence(start=0, end=1, count=25)
def calculate_metrics(cutoff):
Pres = Pr_Prob_Vals.filterMetadata('PresAbs', 'equals', 1)
# 민감도(Sensitivity): 진양성(True Positive) 및 진양성율(True Positive Rate)
TP = ee.Number(Pres.filterMetadata('classification', 'greater_than', cutoff).size())
TPR = TP.divide(Pres.size())
Abs = Pr_Prob_Vals.filterMetadata('PresAbs', 'equals', 0)
# 가음성(False Negative)
FN = ee.Number(Pres.filterMetadata('classification', 'less_than', cutoff).size())
# 특이도(Specificity): 진음성(True Negative) 및 진음성율(True Negative Rate)
TN = ee.Number(Abs.filterMetadata('classification', 'less_than', cutoff).size())
TNR = TN.divide(Abs.size())
# 가양성(False Positive) 및 가양성율(False Positive Rate)
FP = ee.Number(Abs.filterMetadata('classification', 'greater_than', cutoff).size())
FPR = FP.divide(Abs.size())
# 정밀도(Precision)
Precision = TP.divide(TP.add(FP))
# 민감도(Sensitivity)와 특이도(Specificity)의 합
SUMSS = TPR.add(TNR)
return ee.Feature(
None,
{
'cutoff': cutoff,
'TP': TP,
'TN': TN,
'FP': FP,
'FN': FN,
'TPR': TPR,
'TNR': TNR,
'FPR': FPR,
'Precision': Precision,
'SUMSS': SUMSS
}
)
return ee.FeatureCollection(seq.map(calculate_metrics))
# AUC-ROC 계산
def getAUCROC(x):
X = ee.Array(x.aggregate_array('FPR'))
Y = ee.Array(x.aggregate_array('TPR'))
X1 = X.slice(0,1).subtract(X.slice(0,0,-1))
Y1 = Y.slice(0,1).add(Y.slice(0,0,-1))
return X1.multiply(Y1).multiply(0.5).reduce('sum',[0]).abs().toList().get(0)
def AUCROCaccuracy(x):
HSM = ee.Image(images.get(x))
TData = ee.FeatureCollection(TestingDatasets.get(x))
Acc = getAcc(HSM, TData)
return getAUCROC(Acc)
AUCROCs = ee.List.sequence(0,ee.Number(numiter).subtract(1),1).map(AUCROCaccuracy).getInfo() # AUC-ROC
print('AUC-ROC:', AUCROCs)AUC-ROC: [0.866863905325444, 0.6929012345679011, 0.7814009661835749, 0.8694852941176471, 0.8975155279503106, 0.815, 0.8879551820728291, 0.8879551820728291, 0.8890625, 0.8822115384615384]
CPU times: total: 93.8 ms
Wall time: 1min 33s%%time
# AUC-PR 계산
def getAUCPR(roc):
X = ee.Array(roc.aggregate_array('TPR'))
Y = ee.Array(roc.aggregate_array('Precision'))
X1 = X.slice(0,1).subtract(X.slice(0,0,-1))
Y1 = Y.slice(0,1).add(Y.slice(0,0,-1))
return X1.multiply(Y1).multiply(0.5).reduce('sum',[0]).abs().toList().get(0)
def AUCPRaccuracy(x):
HSM = ee.Image(images.get(x))
TData = ee.FeatureCollection(TestingDatasets.get(x))
Acc = getAcc(HSM, TData)
return getAUCPR(Acc)
AUCPRs = ee.List.sequence(0,ee.Number(numiter).subtract(1),1).map(AUCPRaccuracy).getInfo() # AUC-PR
print('AUC-PR:', AUCPRs)AUC-PR: [0.822411299021931, 0.5578869178365702, 0.7876100969714576, 0.856956448157106, 0.76485293504305, 0.7963062122135964, 0.8667958320451926, 0.8667958320451926, 0.7536335533375006, 0.786495555726325]
CPU times: total: 93.8 ms
Wall time: 1min 54s정확성 평가(accuracy assessment) 결과는 다음과 같습니다.
def create_acc_table(acc1, acc2, numiter, acc1_name, acc2_name):
    # 실행이름 목록
    run_names = [f'RUN{num+1:02d}' for num in range(numiter)]
    # 딕셔너리 생성
    data_dict = {
        acc1_name: acc1,
        acc2_name: acc2
    }
    # 데이터프레임 생성
    df = pd.DataFrame(data_dict, index=run_names)
    df.index.name = 'Model'
    # 평균 행 추가
    mean_row = df.mean()
    df = df.append(pd.Series(mean_row, name='Mean'))
    df = df.round(4) # 소수점 넷째자리
    return df

# AUC-ROC 및 AUC-PR 테이블
auc_df = create_acc_table(AUCROCs, AUCPRs, numiter, 'AUC-ROC', 'AUC-PR')
auc_df.to_csv('auc_table.csv', index=True)
auc_df
다음으로는 민감도(sensitivity: 출현 예측의 정확성)과 특이도(specificity: 비출현 예측의 정확성)을 추출할 것입니다. 이러한 지표는 임계값 정의를 필요로 합니다. 각 반복마다 민감도와 특이도의 합을 최대화하는 임계값을 사용합니다. 이 임계값은 비출현 데이터에 잘 작동하는 것으로 확인되었습니다.
%%time

def getMetrics(x):
    HSM = ee.Image(images.get(x))
    TData = ee.FeatureCollection(TestingDatasets.get(x))
    Acc = getAcc(HSM, TData)
    return Acc.sort('SUMSS', False).first()
Metrics = ee.List.sequence(0,ee.Number(numiter).subtract(1),1).map(getMetrics)

# 민감도(sensitivity: 출현 예측의 정확성)
TPR = ee.FeatureCollection(Metrics).aggregate_array("TPR").getInfo()
print('Sensitivity:', TPR)

# 특이도(specificity: 비출현 예측의 정확성)
TNR = ee.FeatureCollection(Metrics).aggregate_array("TNR").getInfo()
print('Specificity:', TNR)
Sensitivity: [0.6923076923076923, 0.75, 0.5217391304347826, 0.75, 0.7619047619047619, 0.7777777777777778, 0.7058823529411765, 0.7058823529411765, 0.95, 0.7692307692307693]
Specificity: [1, 0.7407407407407407, 0.9444444444444444, 0.8823529411764706, 0.9130434782608695, 0.76, 0.9523809523809523, 0.9523809523809523, 0.6875, 0.9375]
CPU times: total: 109 ms
Wall time: 3min 2s# Sensitivity 및 Specificity 테이블
metrics_df = create_acc_table(TPR, TNR, numiter, 'Sensitivity', 'Specificity')
metrics_df.to_csv('metrics_table.csv', index=True)
metrics_df
8. 최적 임계값을 기반으로 사용자 정의 이진 분포 지도화
10회 모델 반복에서 얻은 평균 임계값을 사용하여 이진 분포 확률 지도(binary potential distribution map)을 생성할 수 있습니다.
%%time

# 최적 임계값 추출
MeanThresh = ee.Number(ee.FeatureCollection(Metrics).aggregate_array("cutoff").reduce(ee.Reducer.mean()))
print('Mean threshold:', MeanThresh.getInfo())
Mean threshold: 0.5583333333333332
CPU times: total: 31.2 ms
Wall time: 1min 40s# 최적 임계값을 기반으로 사용자 정의 이진 분포 지도화
DistributionMap2 = ModelAverage.gte(MeanThresh)
vis_params = {
'min': 0,
'max': 1,
'palette': ['white', 'green']}
Map = geemap.Map()
Map.addLayer(DistributionMap2, vis_params, 'Potential distribution2')
Map.addLayer(Data, {'color':'red'}, 'Presence')
Map.add_colorbar(vis_params, label="Potential distribution2", discrete=True, orientation="horizontal", layer_name="Potential distribution2")
Map.centerObject(Data.geometry(), 7)
Map
9. 결과 내보내기
서식지 적합성 지도(Habitat suitability map), 잠재 분포 지도(Potential distribution map) 및 최적 임계값 적용 잠재 분포 지도(Potential distribution map using the best threshold)를 GeoTIFF로 저장합니다. 이제 QGIS에서도 해당 데이터들의 공간 분석이 가능합니다.
out_dir = 'D:/GEODATA'

# 서식지 적합성 지도(Habitat suitability map) GeoTIFF로 저장
out_file = os.path.join(out_dir, 'habitat_suitability.tif')
geemap.ee_export_image(ModelAverage, filename=out_file, region=AOI, scale=1000)

# 잠재 분포 지도(Potential distribution map) GeoTIFF로 저장
out_file = os.path.join(out_dir, 'distribution_map.tif')
geemap.ee_export_image(DistributionMap, filename=out_file, region=AOI, scale=1000)

# 최적 임계치 적용 잠재 분포 지도(Potential distribution map) GeoTIFF로 저장
out_file = os.path.join(out_dir, 'distribution_map2.tif')
geemap.ee_export_image(DistributionMap2, filename=out_file, region=AOI, scale=1000)
